

Step 1: Get your OTLP endpoint and credentials
Set up your OpenTelemetry-compatible backend and obtain the OTLP traces endpoint URL along with any required authentication headers. For Axiom:- Create an Axiom account and dataset
- Go to Settings > API Tokens and create a new token
- Your endpoint is
https://api.axiom.co/v1/traces - You’ll need headers:
Authorization: Bearer xaat-xxxandX-Axiom-Dataset: your-dataset
- Deploy an OpenTelemetry Collector with an OTLP receiver
- Configure the receiver to listen on a publicly accessible endpoint
- Note the endpoint URL (typically ending in
/v1/traces)
Step 2: Enable Broadcast in OpenRouter
Go to Settings > Observability and toggle Enable Broadcast.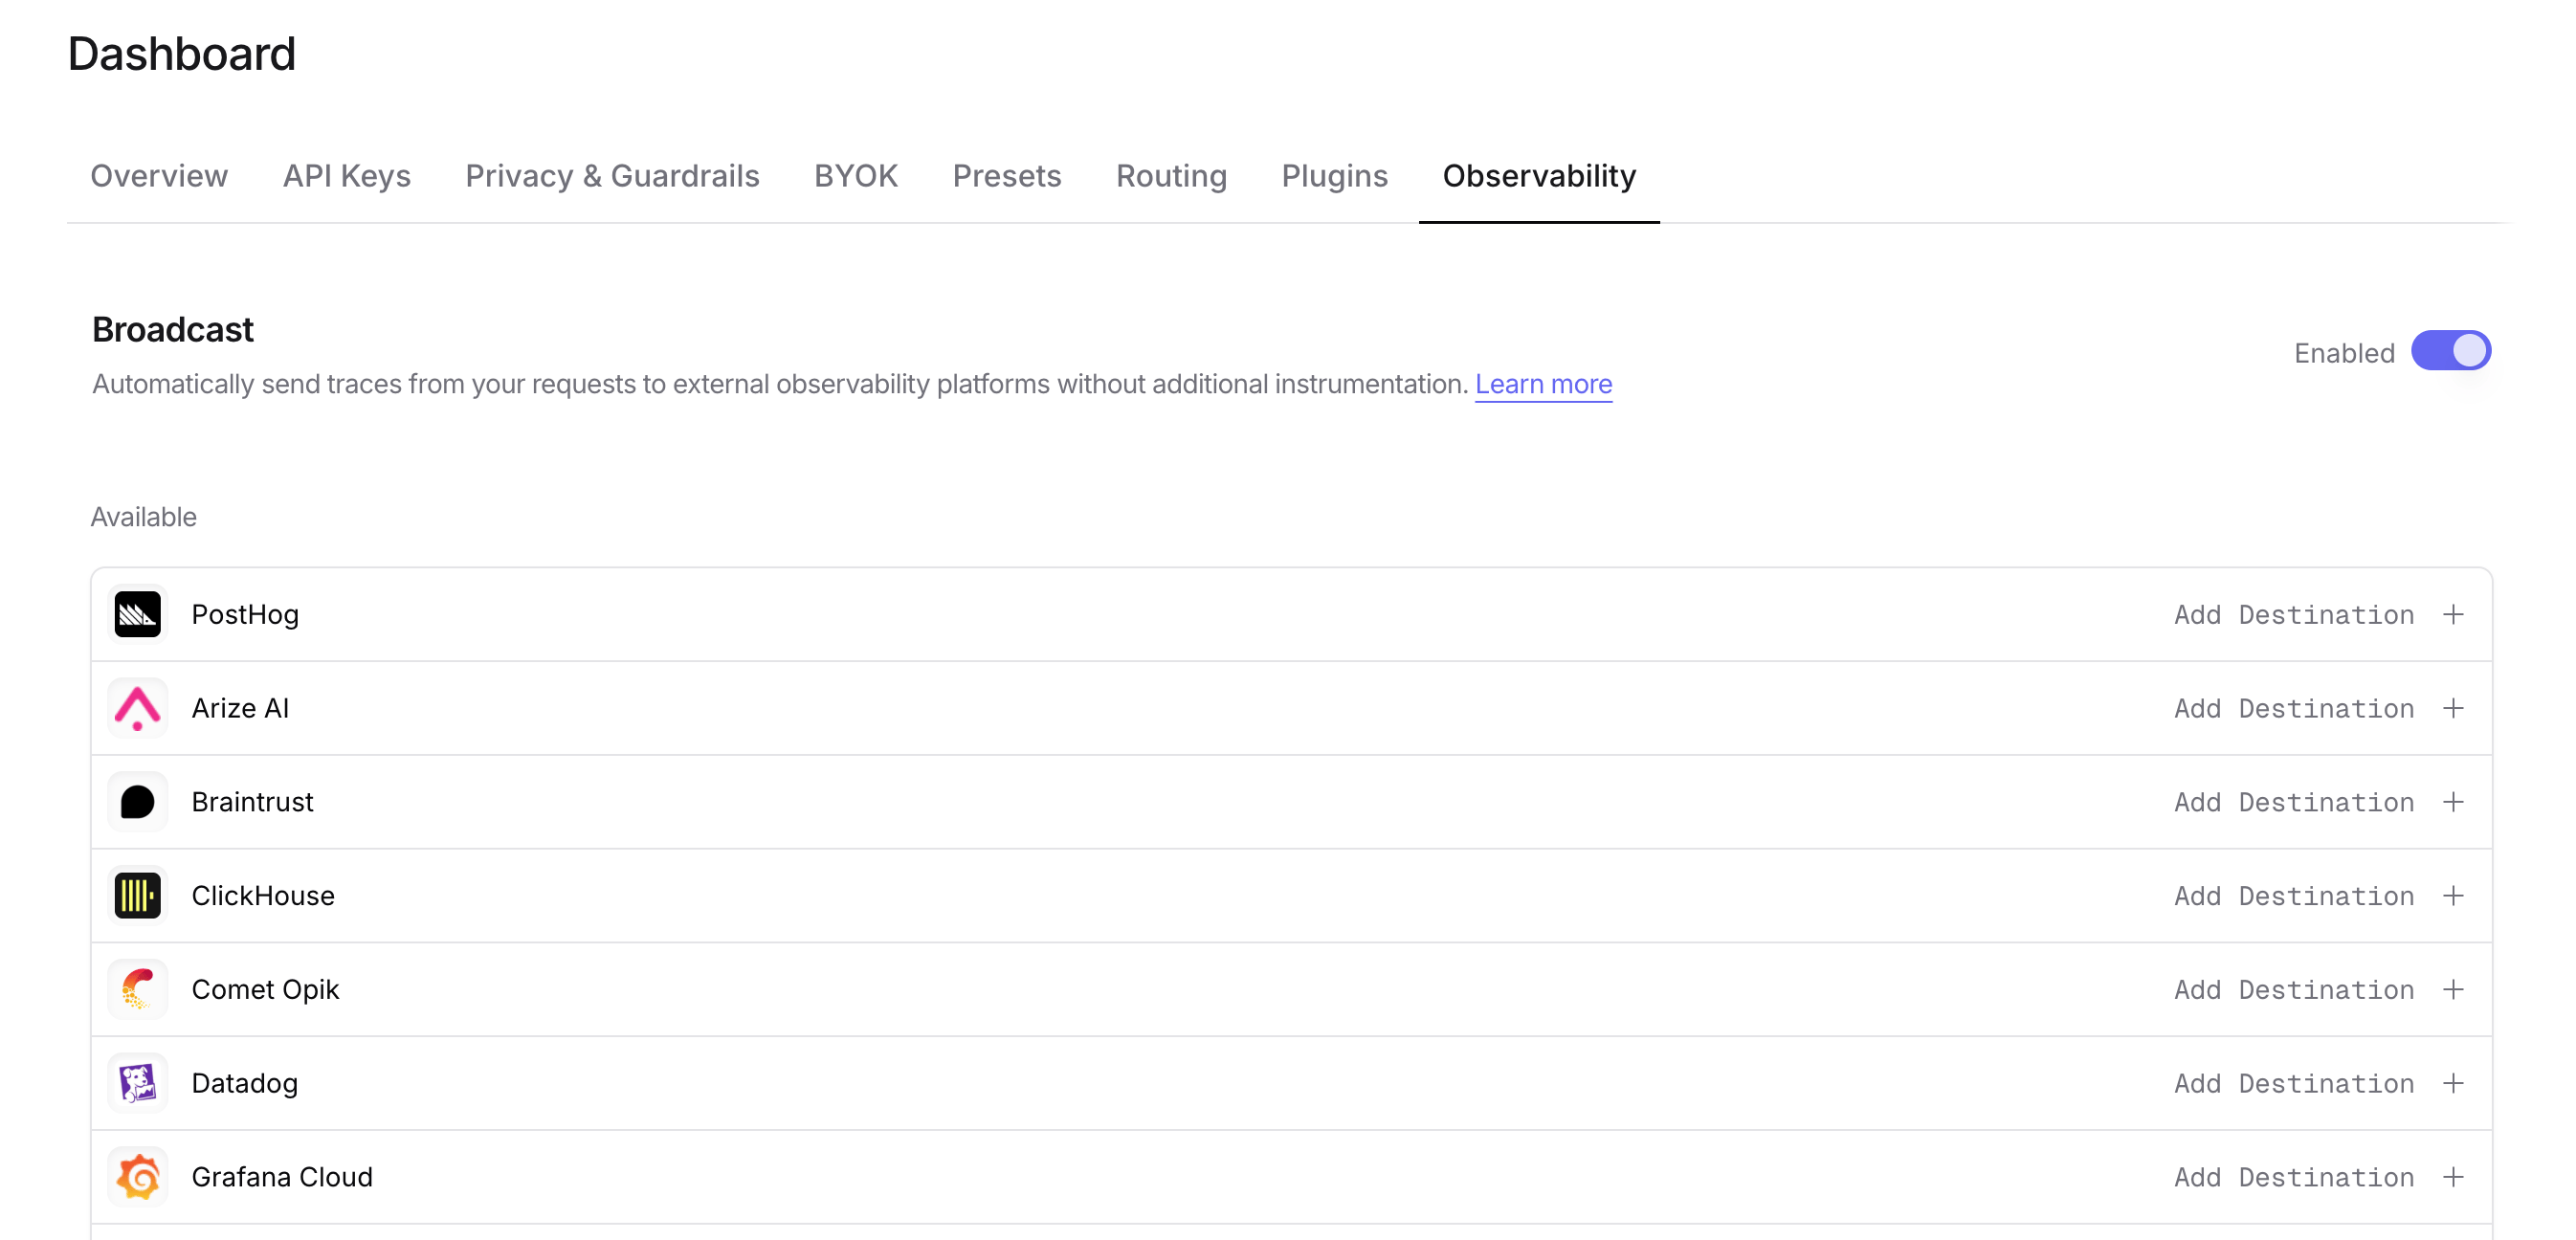
Step 3: Configure OpenTelemetry Collector
Click the edit icon next to OpenTelemetry Collector and enter:- Endpoint: Your OTLP traces endpoint URL (e.g.,
https://api.axiom.co/v1/tracesorhttps://your-collector.example.com:4318/v1/traces) - Send OTLP metrics (optional, off by default): Also send OTLP metrics for each generation, with the same headers. Leave it off to send traces only.
- Metrics endpoint: Your OTLP metrics endpoint URL (e.g.,
https://your-collector.example.com:4318/v1/metrics). Required while Send OTLP metrics is on: the form keeps Test Connection disabled until it is set, and the API (shouldSendMetrics: truewithoutmetricsEndpoint) rejects the configuration with “Metrics endpoint is required while Send OTLP metrics is on”. Ignored while the checkbox is off, so turning it off stops metrics without clearing the URL. - Headers (optional): Custom HTTP headers as a JSON object for authentication
Step 4: Test and save
Click Test Connection to verify the setup. The configuration only saves if the test passes. With Send OTLP metrics on, the test also sends oneopenrouter.connection_test data point to the metrics endpoint and fails if that endpoint rejects it.
Step 5: Send a test trace
Make an API request through OpenRouter and view the trace in your OpenTelemetry backend.Compatible backends
The OpenTelemetry Collector destination works with any backend that supports OTLP over HTTP, including:- Axiom - Cloud-native log and trace management
- Jaeger - Distributed tracing platform
- Grafana Tempo - High-scale distributed tracing backend
- Honeycomb - Observability for distributed systems
- Lightstep - Cloud-native observability platform
- Self-hosted OpenTelemetry Collector - Route traces to multiple backends
Metrics
With Send OTLP metrics on and a Metrics endpoint set, OpenRouter sends OTLP metrics alongside traces, as a separate OTLP/HTTP JSON request. The numbers are the ones already on the generation span, as time series you can aggregate without deriving them from spans.What is sent
Each generation produces one set of data points, measured from the generation itself; provider fallback attempts do not add to the counts.
Histograms use the bucket boundaries of the OpenTelemetry GenAI metric conventions: token buckets for
openrouter.token.usage, and time-to-first-token buckets for the two openrouter.* first-token metrics. openrouter.router.duration uses buckets from 1 ms to 5 s, since routing overhead is usually a few milliseconds. openrouter.router.phase.duration extends those buckets to 100 s, because the provider and client-wait phases last as long as the generation. openrouter.router.attempts has one bucket per count up to 5, then 8 and 16. The router phase of openrouter.router.phase.duration differs from openrouter.router.duration because they come from different measurements: openrouter.router.duration is the time before the successful provider response less that attempt’s own latency, so failed fallback attempts count toward it, and it includes guardrail, tool, routing-model, and media time. The router phase is the router’s own time from the router timing breakdown: it reports failed attempts as provider_failed and those four as their own phases, but it includes router time after dispatch. Neither value is always the larger. openrouter.cost and openrouter.upstream_inference_cost are sent whether or not Cost is enabled under Additional generation metadata, because the same values are already on every span as gen_ai.usage.total_cost, gen_ai.usage.input_cost, and gen_ai.usage.output_cost.
Attributes
Every data point carries only these attributes, so the number of series stays bounded:
A
0 token breakdown or upstream cost part means OpenRouter’s usage accounting recorded none, which for some providers or request types is a default rather than a provider-reported value. A breakdown or cost part is left out only when accounting has no value for it.
The resource carries service.name = openrouter. Trace, span and generation IDs, user and session IDs, prompts, and custom metadata are never metric attributes; use traces for those.
Delta temporality
Data points use delta temporality: each one counts a single generation, over a window from the generation’s start to its end. OpenRouter keeps no running totals between requests, so there are no cumulative series to reset. Data points from concurrent requests on the same series have overlapping windows. Backends that store delta metrics natively ingest these as they arrive. Prometheus-compatible backends such as Prometheus, Mimir, and Thanos store cumulative series, so they need delta ingestion support or a conversion step in front of them. The OpenTelemetry Collector’sdeltatocumulative processor is one such step, but it applies the same checks to every metric type. It drops a data point whose timestamp is not newer than the last one it accepted for that series (ErrOutOfOrder), and one that starts before the series’ first data point (ErrOlderStart). OpenRouter sends one data point per generation, in delivery order rather than time order, so on a busy series some points arrive out of order and are dropped, including two generations that end in the same millisecond. Every metric loses points on that path: openrouter.requests, openrouter.cost, and openrouter.upstream_inference_cost undercount your real requests and spend, and histograms lose samples. Check how your backend handles delta data before you build alerts or billing reports on these counts.
Building metrics from spans instead
If you run Prometheus or Mimir and thedeltatocumulative drops matter to you, you can build cumulative metrics from the traces OpenRouter sends instead. The Collector’s spanmetrics connector and Grafana Tempo’s metrics generator both count calls and record durations from spans as they arrive and keep the running totals themselves, so the deltatocumulative ordering checks don’t apply. The Collector connector accepts spans whenever they arrive. Tempo’s metrics generator does not: it discards spans that ended more than metrics_ingestion_time_range_slack before they reach it (30 seconds by default), and counts them in tempo_metrics_generator_spans_discarded_total with reason="outside_metrics_ingestion_slack". OpenRouter sends a trace after the generation ends, through a queue that retries failed deliveries, so a retried trace, or a provider-attempt span that ended well before its generation finished, can arrive outside that window. Raise the setting if that counter grows. You choose which span attributes become labels. They count spans and measure span durations; they don’t add up attribute values such as token counts or cost. Every span becomes a sample, including the child spans for provider attempts, and the connector’s default span.name label keeps those series apart.
A minimal connector that turns OpenRouter spans into request counts and durations by model and provider:
prometheusremotewrite configured for your Mimir endpoint, and you can keep exporting the traces too. OpenRouter has not tested this setup against its payloads.
Delivery
- Metrics are sent only after the trace for that generation is accepted. A trace that is retried is sent with its metrics once, on the attempt that delivers it.
- A failed metrics request does not fail or retry the trace and is not retried itself, so counts can fall short while the metrics endpoint is unavailable.
- Metrics follow this destination’s sampling rate and filter rules, because they are sent with the traces it sends. At a sampling rate of 0.5, the counts cover about half of your requests.
- Privacy Mode does not change metrics: they never contain prompt or completion content.
Example collector configuration
A collector that receives traces and metrics from OpenRouter on port 4318 and forwards both to an OTLP backend:https://your-collector.example.com:4318/v1/traces, turn on Send OTLP metrics, and set Metrics endpoint to https://your-collector.example.com:4318/v1/metrics.
Custom Metadata
Custom metadata from thetrace field is sent as span attributes in the OTLP payload. How this metadata appears depends on your downstream backend.
Supported Metadata Keys
Example
Span Attributes
Custom metadata keys are included as span attributes under thetrace.metadata.* namespace. For example, environment from the trace field becomes trace.metadata.environment in the OTLP payload.
Standard GenAI semantic conventions (gen_ai.*) are used for model, token usage, and cost attributes.
Prompt and completion content is emitted once per generation, on the generation span, as span.input / span.output and gen_ai.prompt / gen_ai.completion. The root span no longer carries a duplicate copy under trace.input / trace.output; if your dashboards or processors read those keys, switch them to the generation-span attributes.
Additional Context
- The
userfield maps touser.idin span attributes - The
session_idfield maps tosession.idin span attributes - Your downstream backend determines how these attributes are indexed, queried, and displayed
- Using
parent_span_idlets you link OpenRouter traces to your application’s existing distributed traces
Billing quantities
Cache-write details are exported as numeric attributes on the generation span:
With Cost enabled under Additional generation metadata, the same quantities and native-tool counters are also queryable under
span.metadata.openrouter_generation.*. For example:
intValue and the estimate flag as boolValue. Root spans also carry generation metadata under trace.metadata.openrouter_generation.*. Read each generation once. These representations repeat the same generation quantities; do not add them together. Unavailable quantities are omitted from OTEL attributes, while zero and false are preserved. See Cost for interpretation and billing caveats.
Cost allocation
With Cost allocation enabled, the cost-allocation block is flattened under its own key, independently ofopenrouter_generation. Counts are intValue attributes and costs are stringValue decimals, so no precision is lost:
trace.metadata.openrouter_cost_allocation.*. Read each generation once.
Raw provider usage
Unlike the quantities above,upstream_raw_response_usage is not flattened into one attribute per provider field. It is sent as a single stringValue attribute holding JSON, because its keys are provider-controlled and can change without notice:
null — which is sent as the four-character string null, distinct from the attribute being absent. When it decodes to null, upstream_raw_response_usage_suppression_reason says whether the value was suppressed or simply unavailable.
This attribute keeps its path even when a generation carries more ordinary metadata than fits in the attribute budget. Because collectors and backends impose their own attribute value length limits, verify that your pipeline stores the complete JSON string before relying on it.
Privacy Mode
When Privacy Mode is enabled for this destination, prompt and completion content and provider error text are excluded from traces. All other trace data — token usage, costs, timing, model information, and custom metadata — is still sent normally. Raw provider usage is replaced withnull and reported as privacy_mode, because a provider’s usage object can contain arbitrary future fields. See Privacy Mode for details.